
Know the state of your estate.
Per-metric health, configuration change tracking, fleet-wide dashboards, intrusion-detection alerts, and ingested syslog — each attributed to the resource and location it belongs to, so context is never an aggregation exercise.
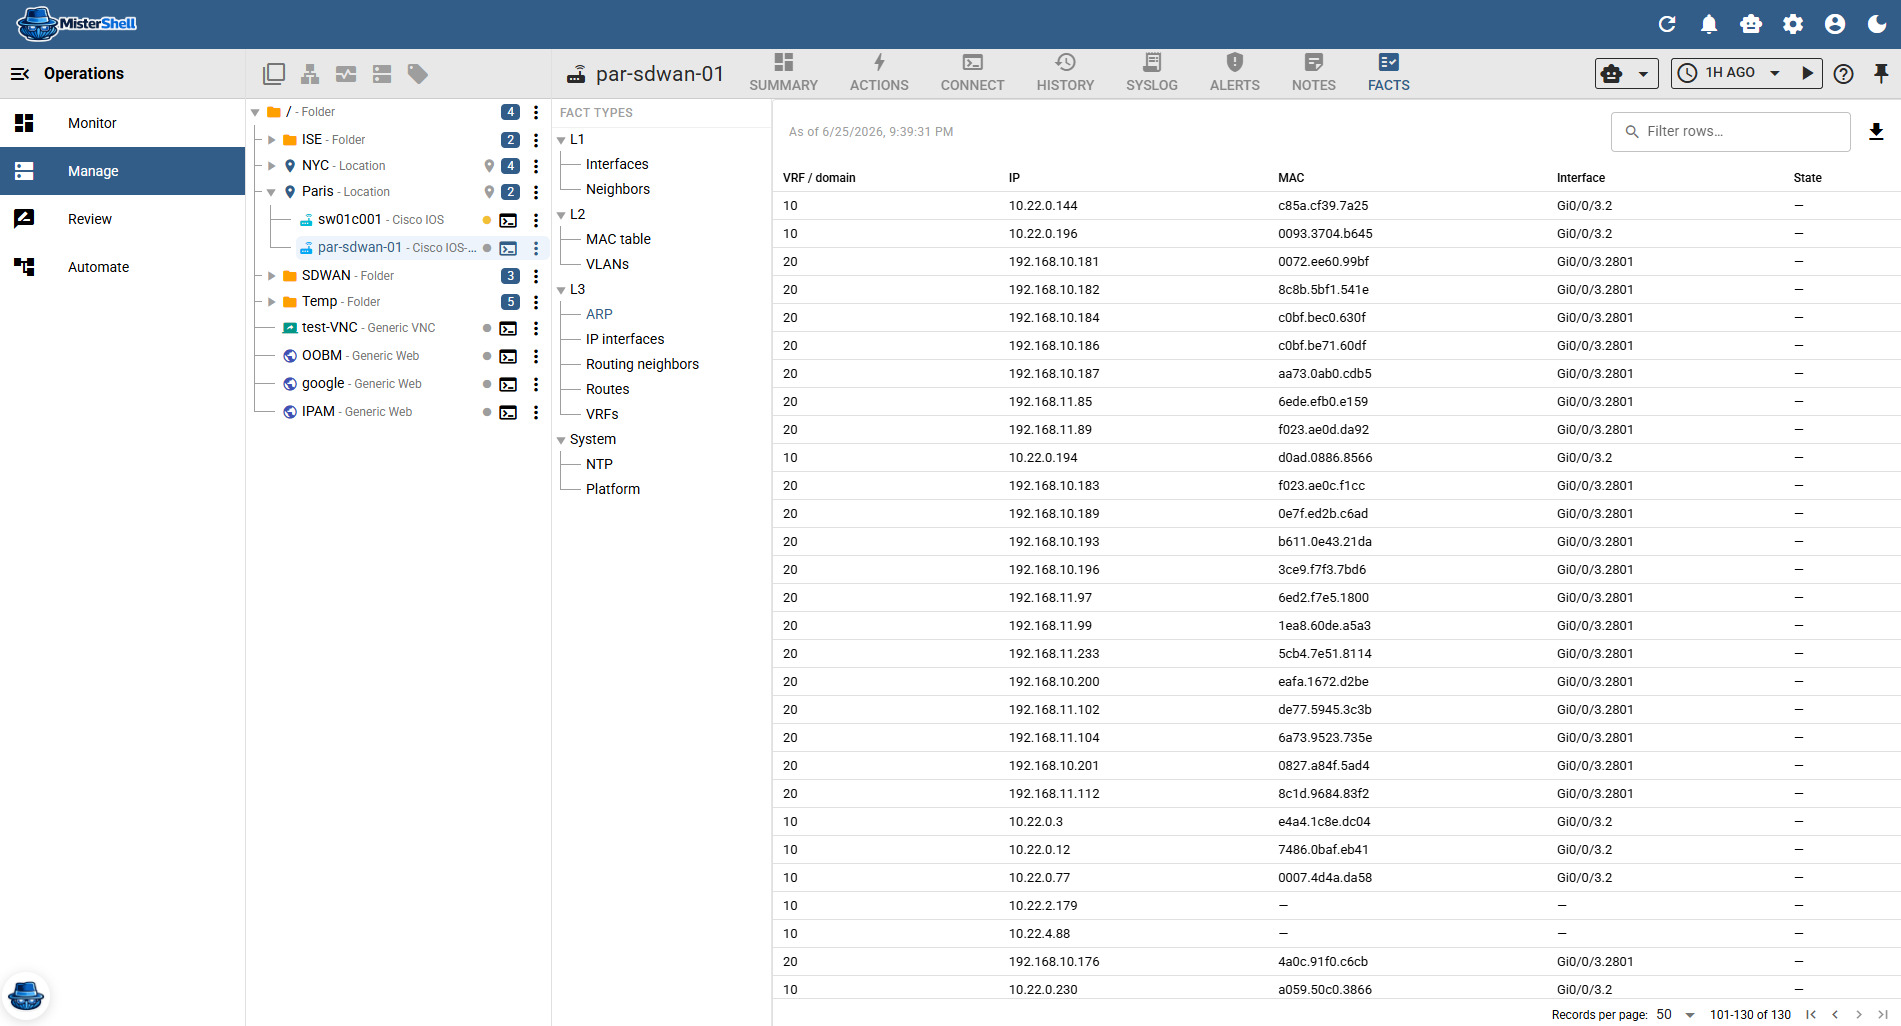
Operational context lives in too many places
Telemetry without context
Metrics, logs, and alerts sit in separate tools, none of which know which device, site, or change they relate to. Correlation is manual.
Silent configuration drift
Configuration changes often land without a tracked diff. By the time drift surfaces as an incident, working out what changed and when means diffing by hand across sources.
Alerts you cannot attribute
An IDS alert or a syslog line is only useful if you know which managed resource it belongs to — otherwise it is noise.
No continuous check that state matches intent
Health says up or down, and change tracking shows what config text moved — but neither answers "is every resource still in the operational state I require": NTP synchronized, an approved version running, the expected routes present.
No single situational view
Leadership and on-call both want one place that shows how the whole estate is doing right now, and how it got there.
One contextual model for health, change, and events
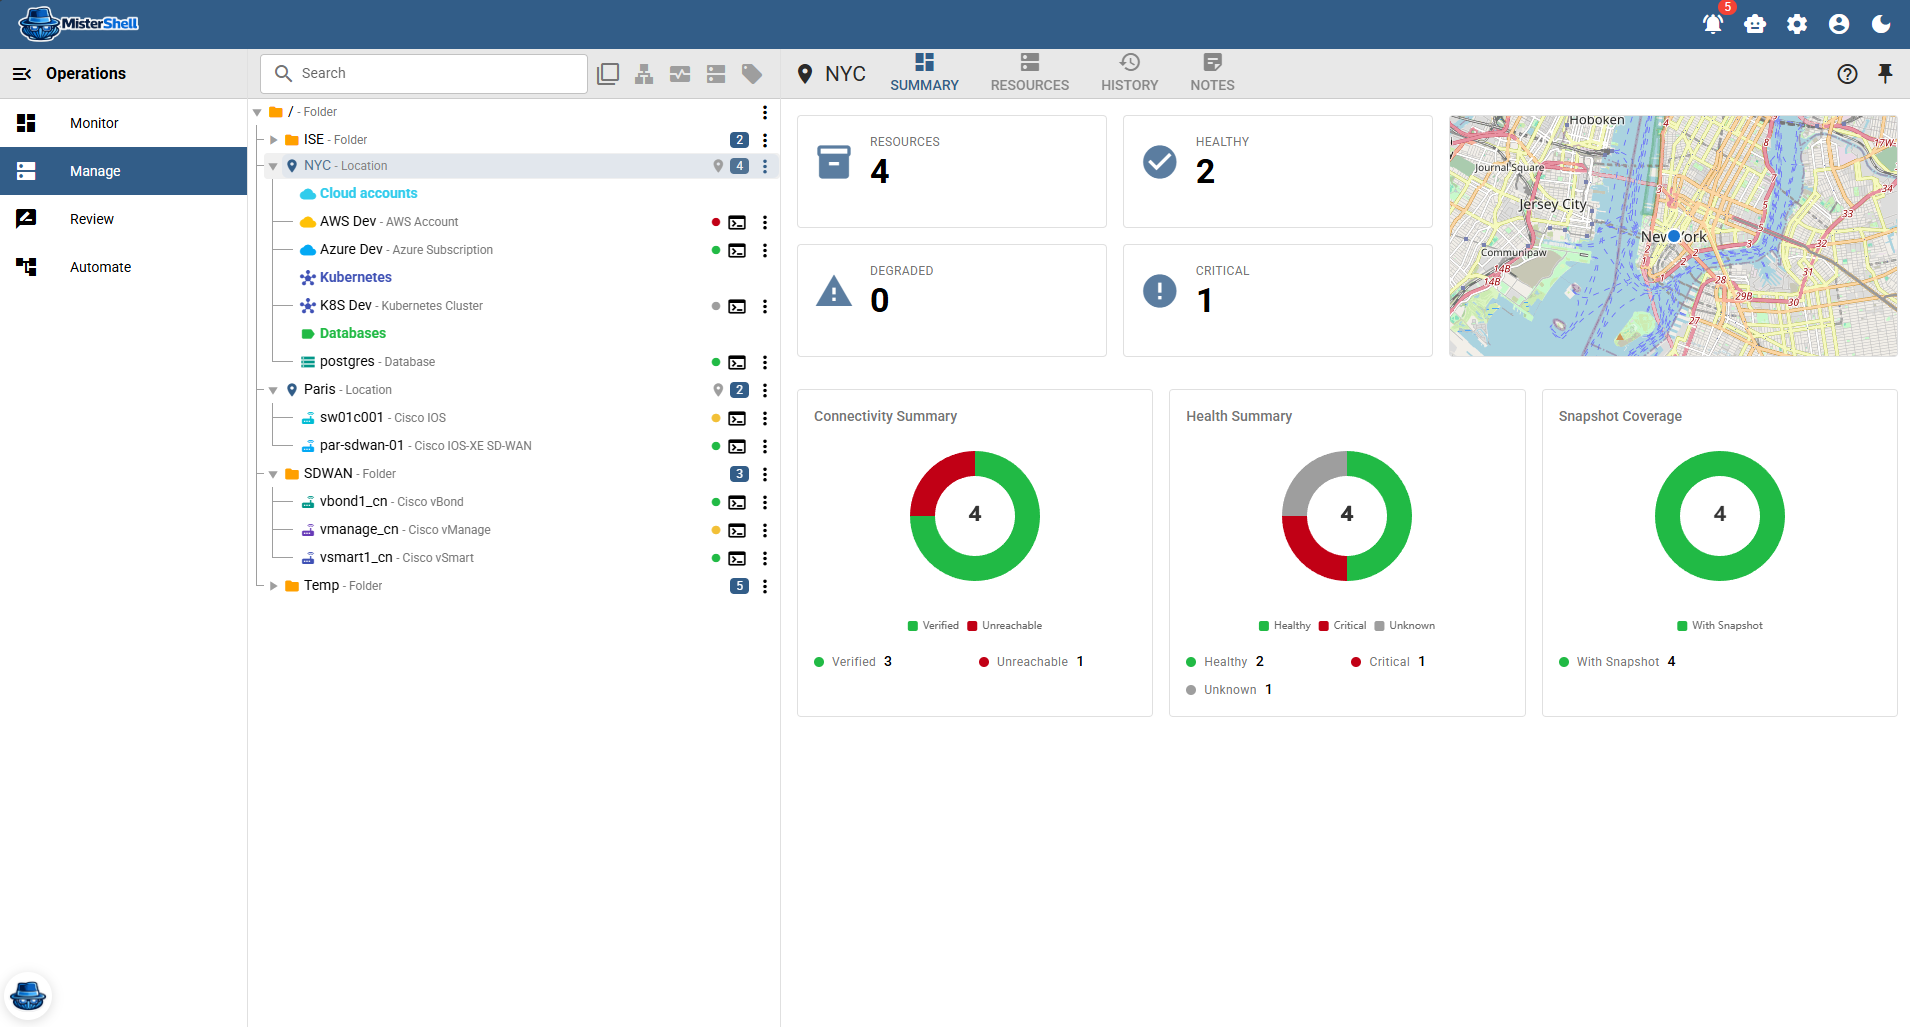
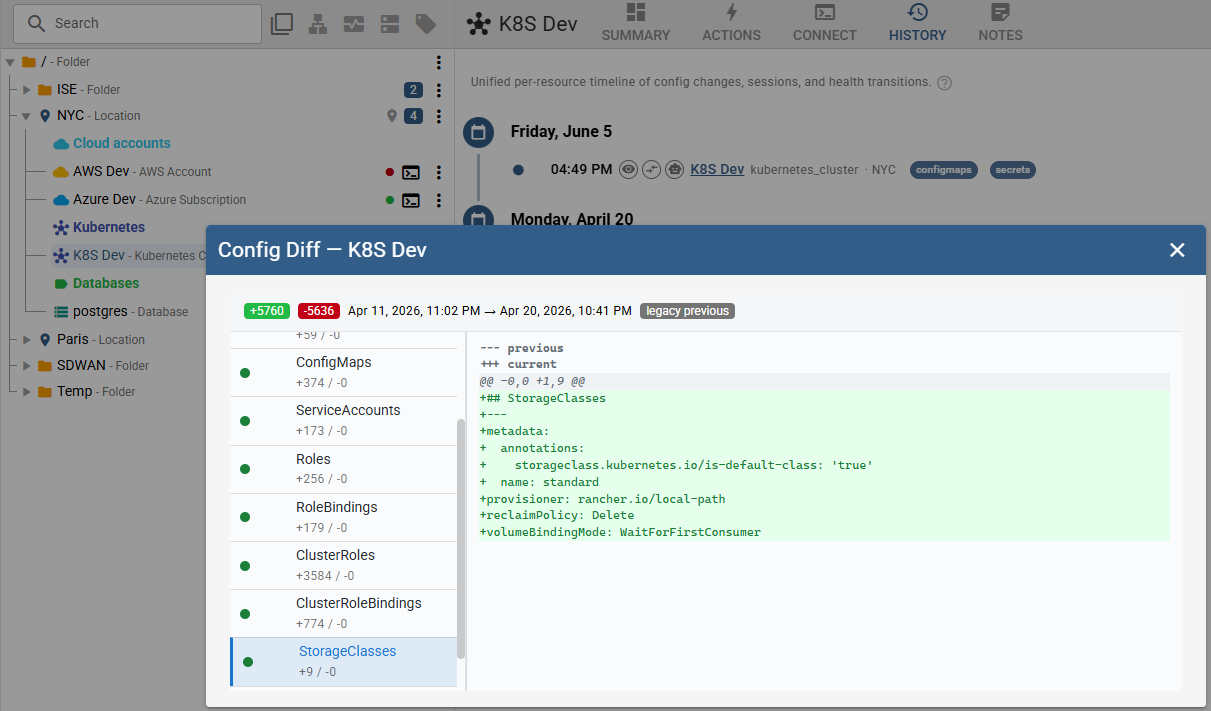
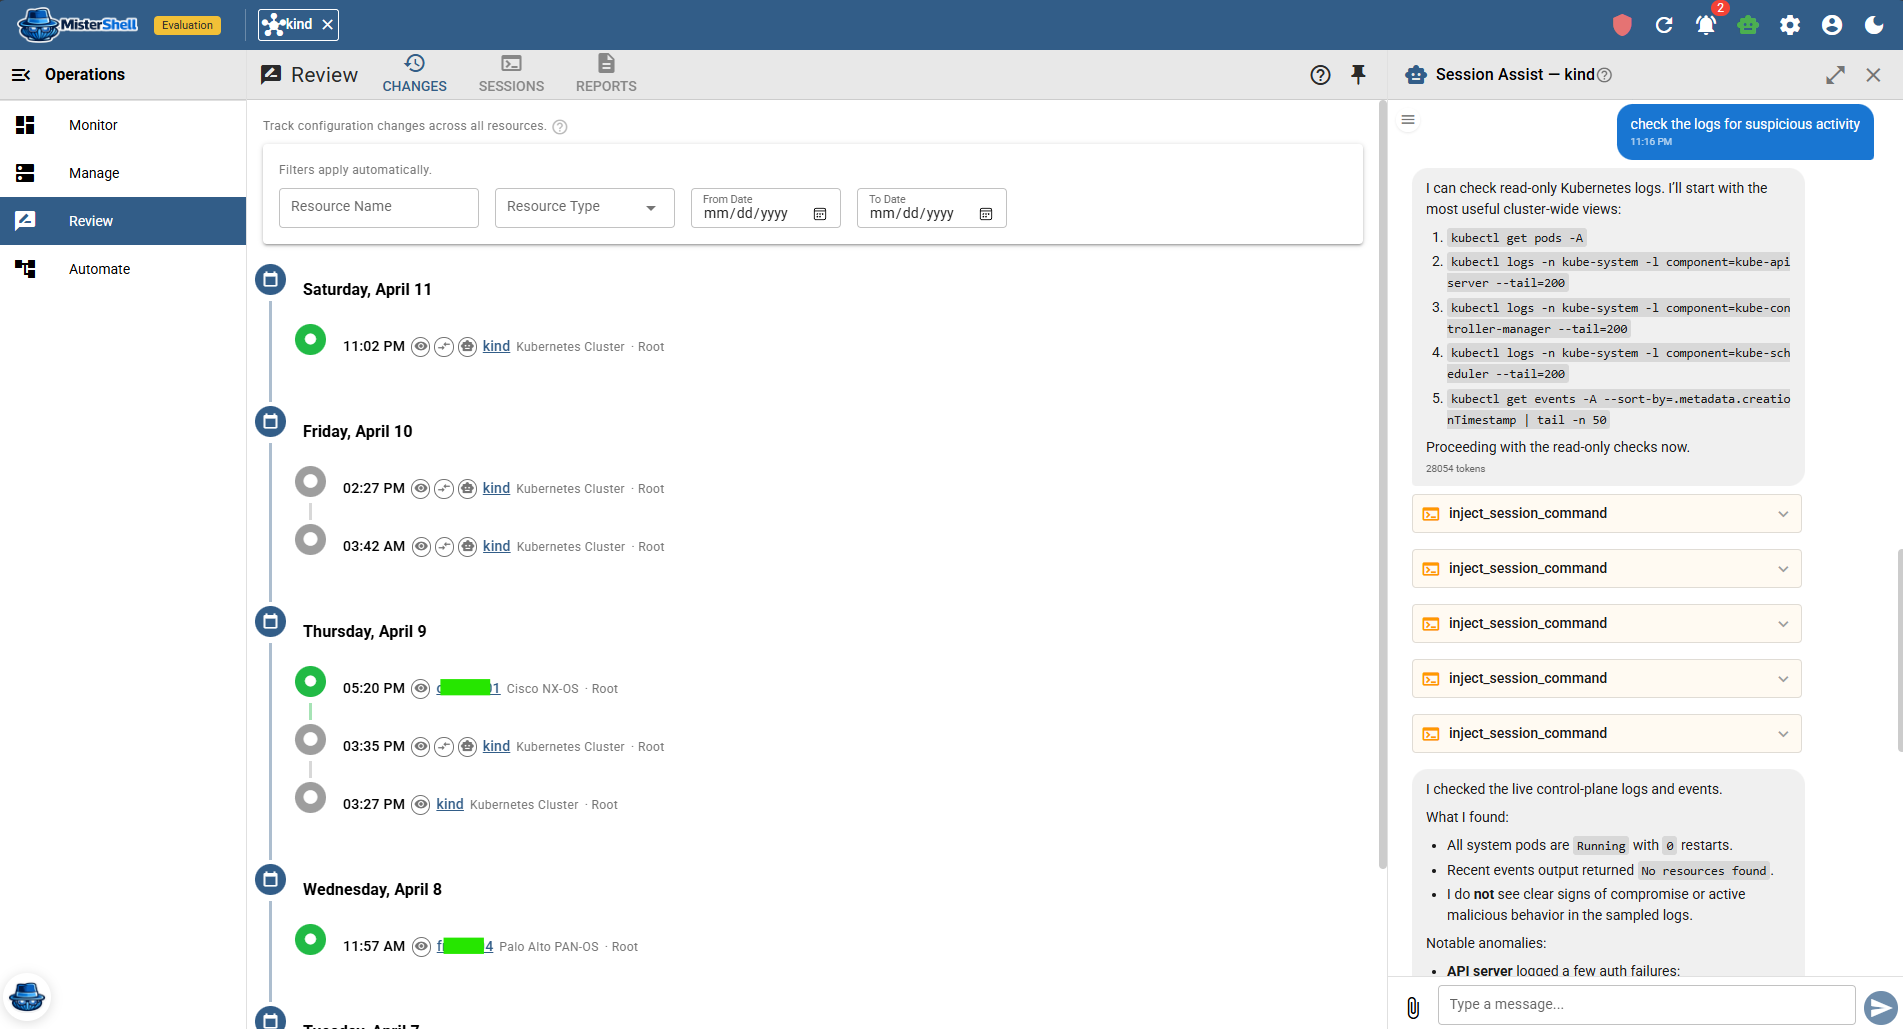
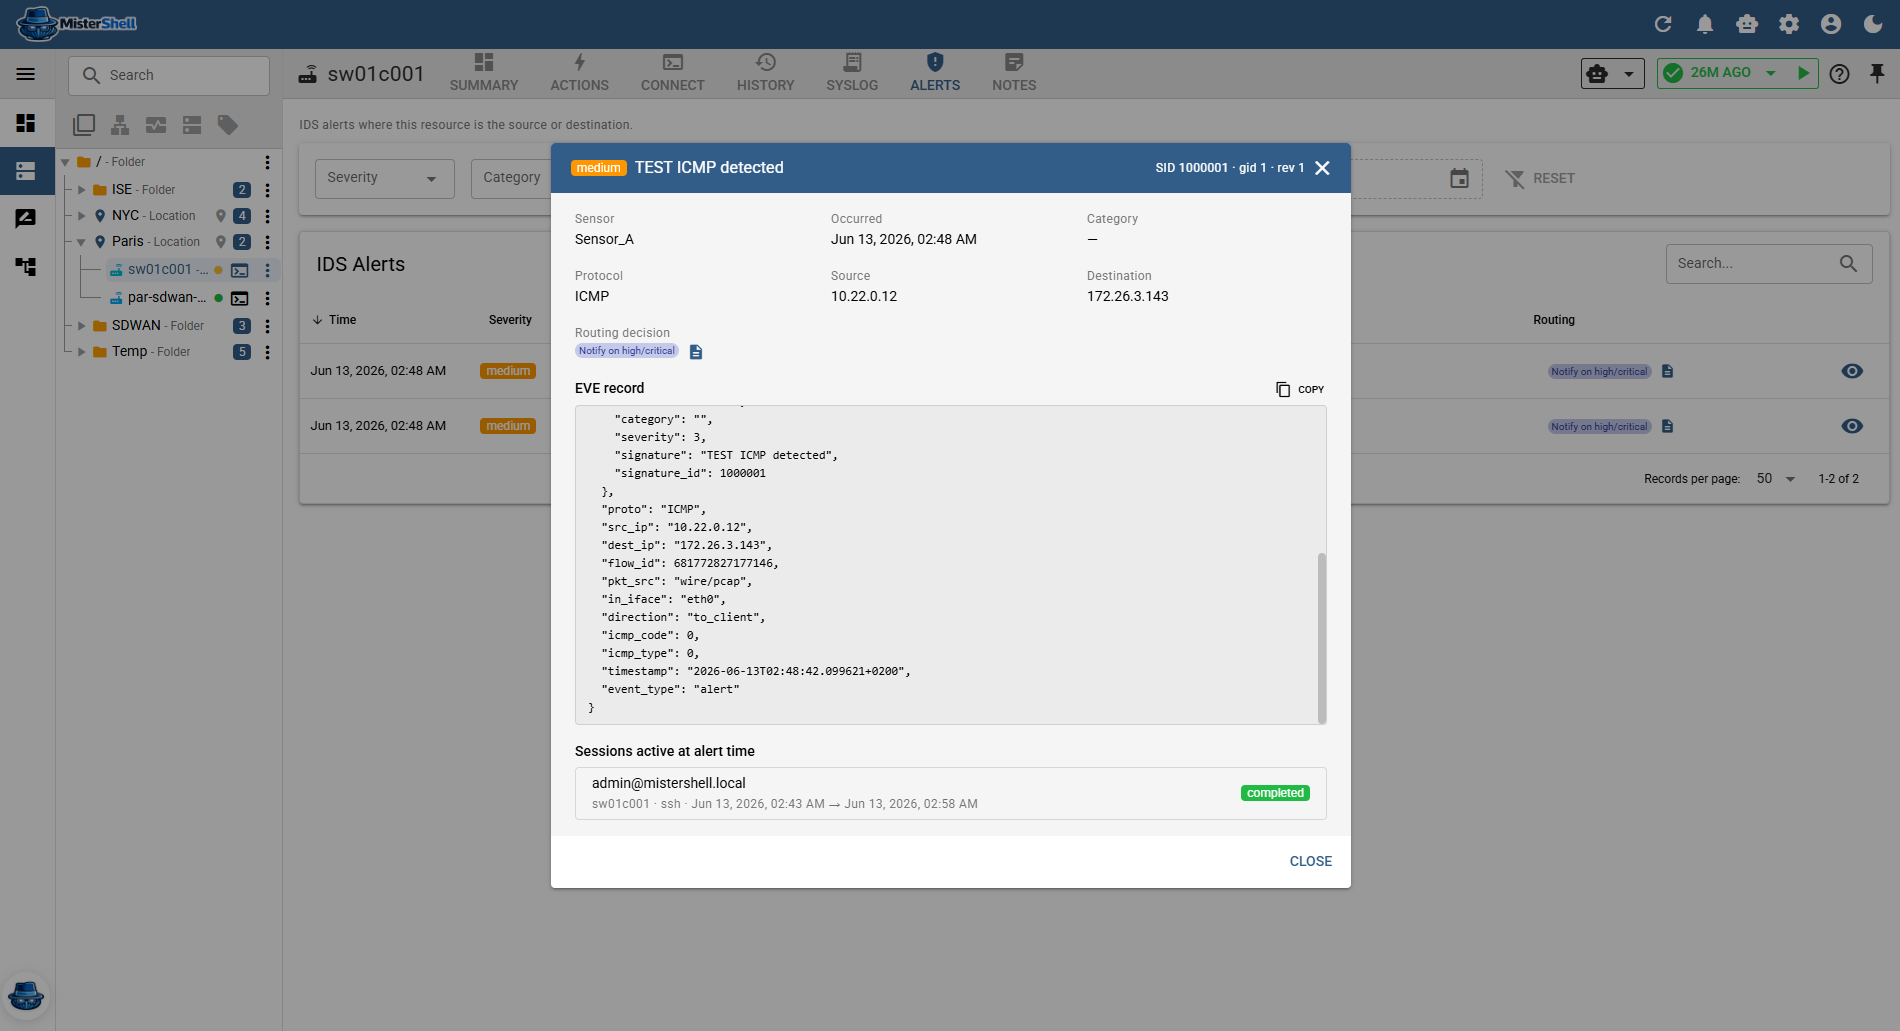
MisterShell keeps per-resource identification, configuration, and health data current automatically, organized in a hierarchy of locations — and collects operational facts the same way from devices and Azure subscriptions alike. Configuration snapshots produce structured diffs and a human-readable changelog. Intrusion-detection alerts and inbound syslog are attributed to the resource and location they involve, so they show up in context — on the resource and in review — not in a separate silo.
Health, history, and security signal in context
Health monitoring
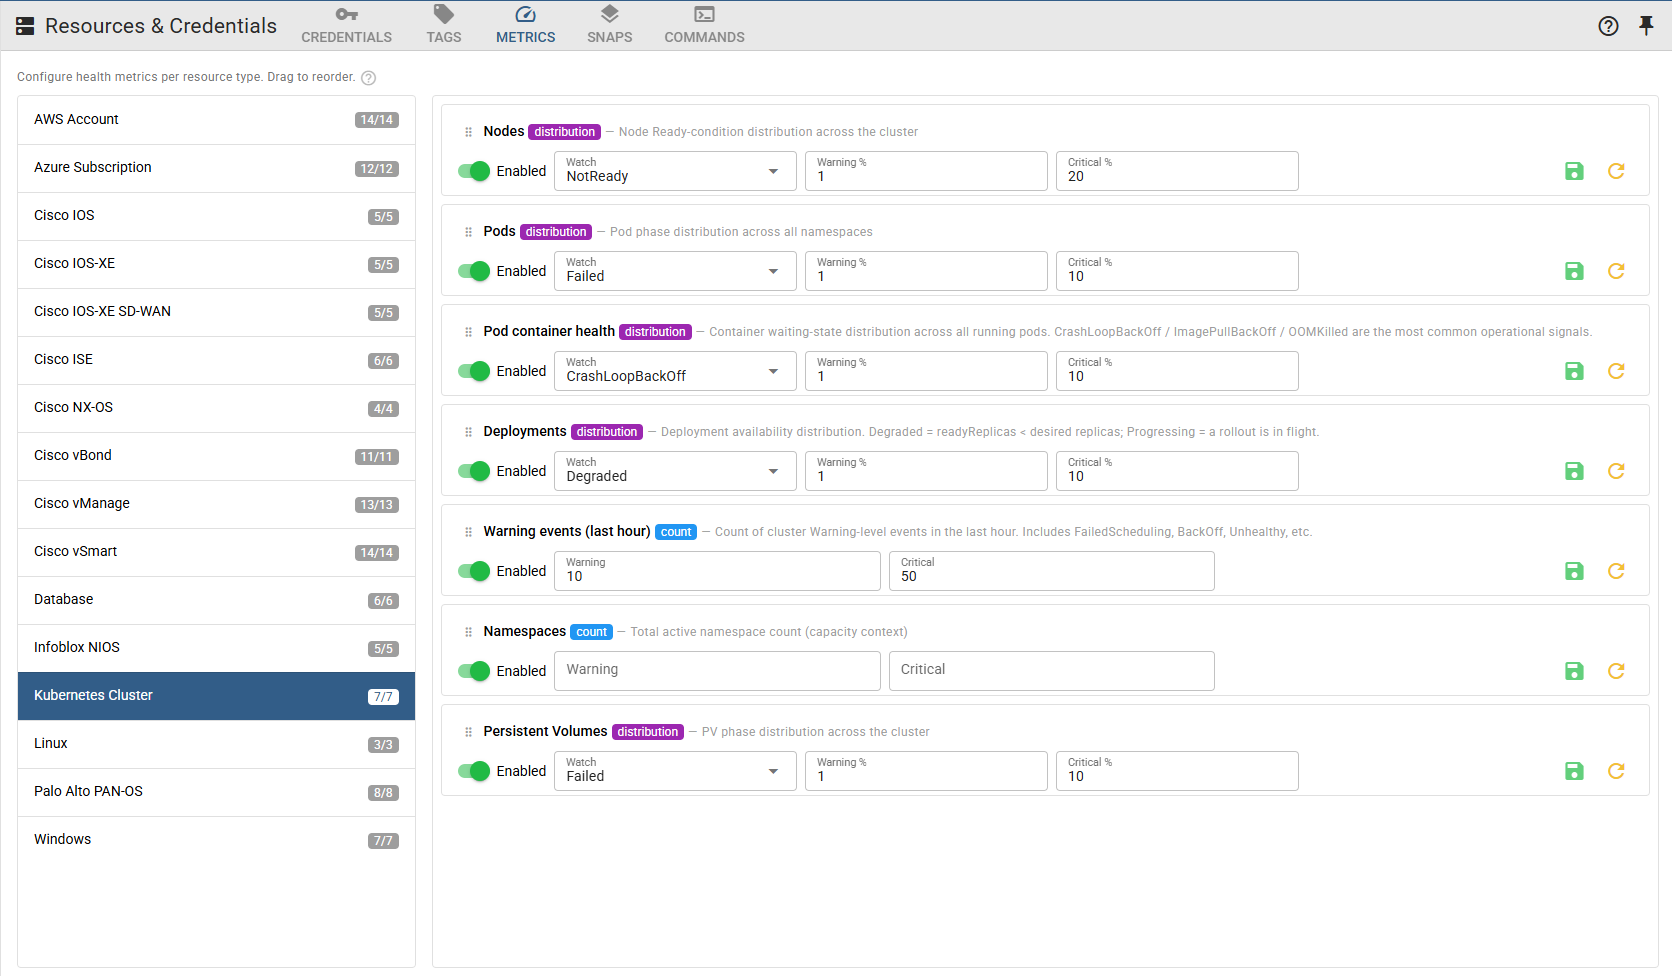
Per-metric health history with warn and critical thresholds, surfaced alongside the resource and its sessions — and a fleet-wide Health timeline in Review that shows how the estate is doing now and how it got there.
Configuration change tracking
Automatic configuration snapshots with structured diffs and a timestamped, searchable changelog — down to interfaces, running-config, policies, and cluster manifests.
Fleet dashboards
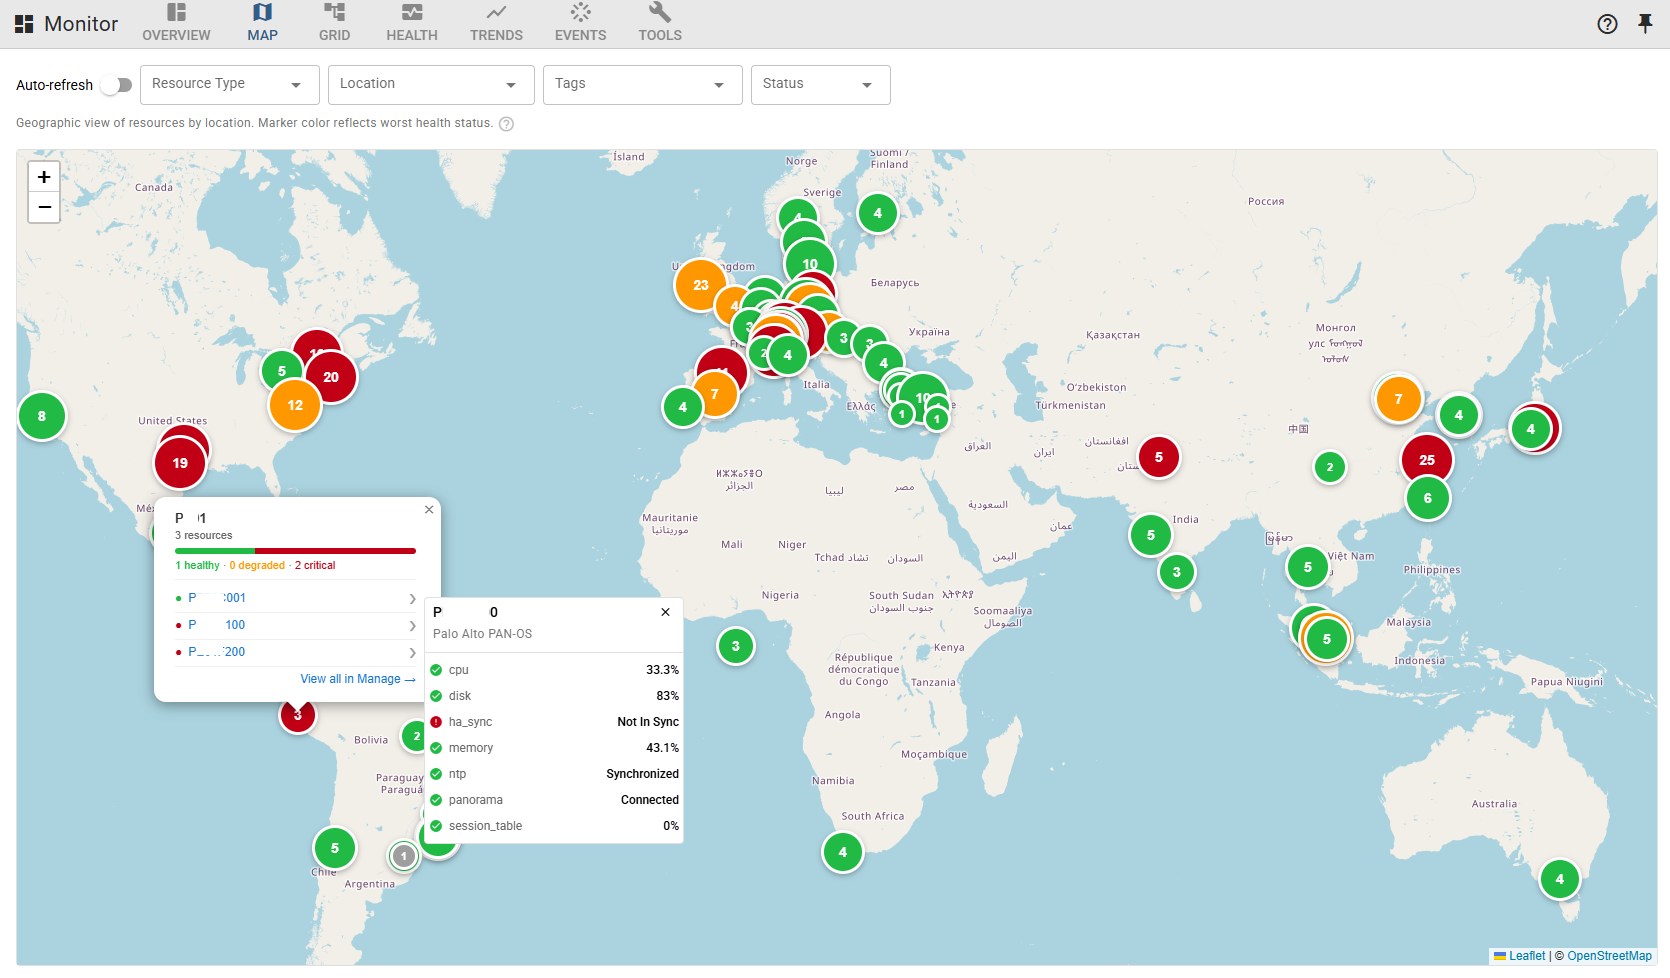
A Monitor view with an overview, a geographic map, a site treemap, live health, historical trends, and a real-time activity feed.
IDS alerts, attributed
Passive sensors stream intrusion-detection alerts; when an endpoint belongs to a managed resource, the alert is linked to it automatically and shown on the resource’s Alerts tab. (Licensed.)
Syslog ingestion, attributed
Collectors ingest inbound device and server syslog into one searchable store, attributed to the right location and resource, with full metadata and structured data. (Licensed.)
Operational compliance checks
Declare an operational intent — NTP synchronized, an approved version running, an expected route present — and MisterShell verifies it against each resource's actual collected state on every snapshot. Checks can reason across related facts — a default route inside a given VRF, say. The result is a pass/fail compliance heatmap over time, at fleet, location, or resource scope, a fleet-wide Compliance timeline in Review, and the option to notify or log the moment a resource flips. Part of Fact Policy, in the Enterprise edition.
Author and push configuration
Beyond tracking drift, author configuration as reusable templates and push it to many resources — filling per-device values, previewing the exact change, and applying it with every push recorded on the timeline. Pair it with compliance checks and automation to close the loop: detect drift and push the fix — across configuration-capable resource types, not just one vendor's gear. (Enterprise.)
On-demand diagnostics
Run ping, traceroute, DNS, and port checks from the workers you pick, side by side, without opening a session.
Get in Touch
Want a guided demo, or a trial license to evaluate Pro or Enterprise on your own infrastructure? Tell us — we'd love to hear from you.